

Charts
Visualize your Notion data beautifully with a variety of interactive charts—from bar and line to radar and pie—designed for dashboards, tracking, and insights.
Inspect the widget before it reaches a live page.
Tune labels, data, colors, and layout from one editor.
Embed the finished specimen back into Notion.
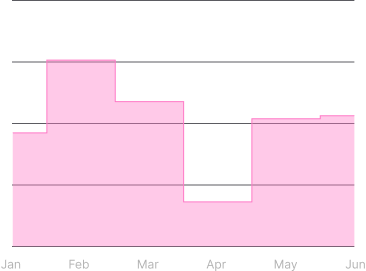
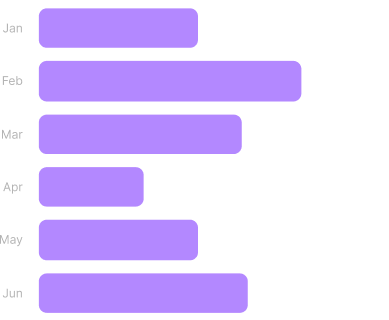
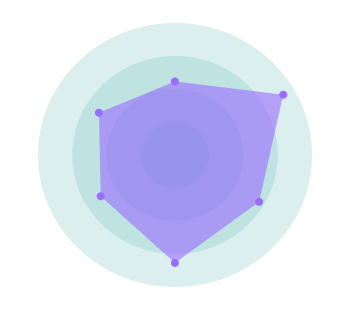
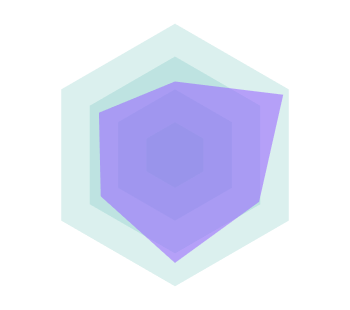
Type covers in this category.
Open a type dossier for the available variants and implementation notes.
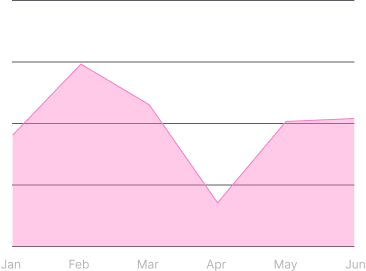
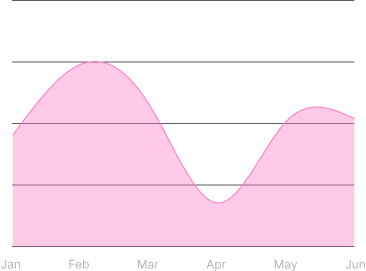
Area · Chart
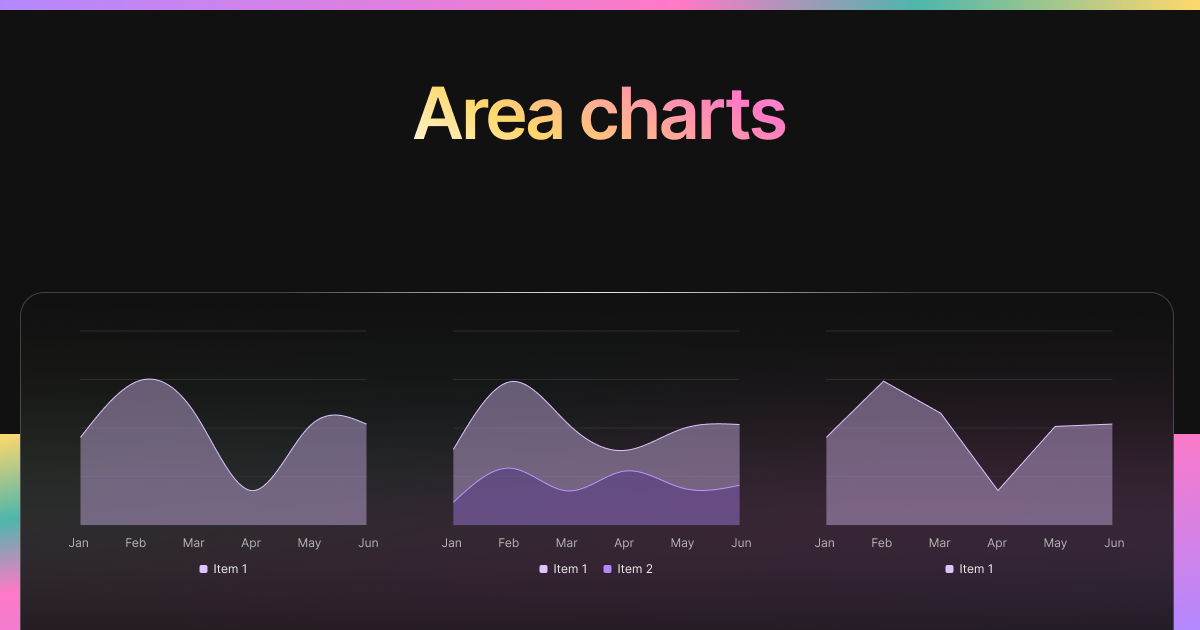
Area Chart
Create sleek area charts in Notion to visualize trends, compare data ranges, and enhance project dashboards. Customize styles, axes, opacity, and more.
Open type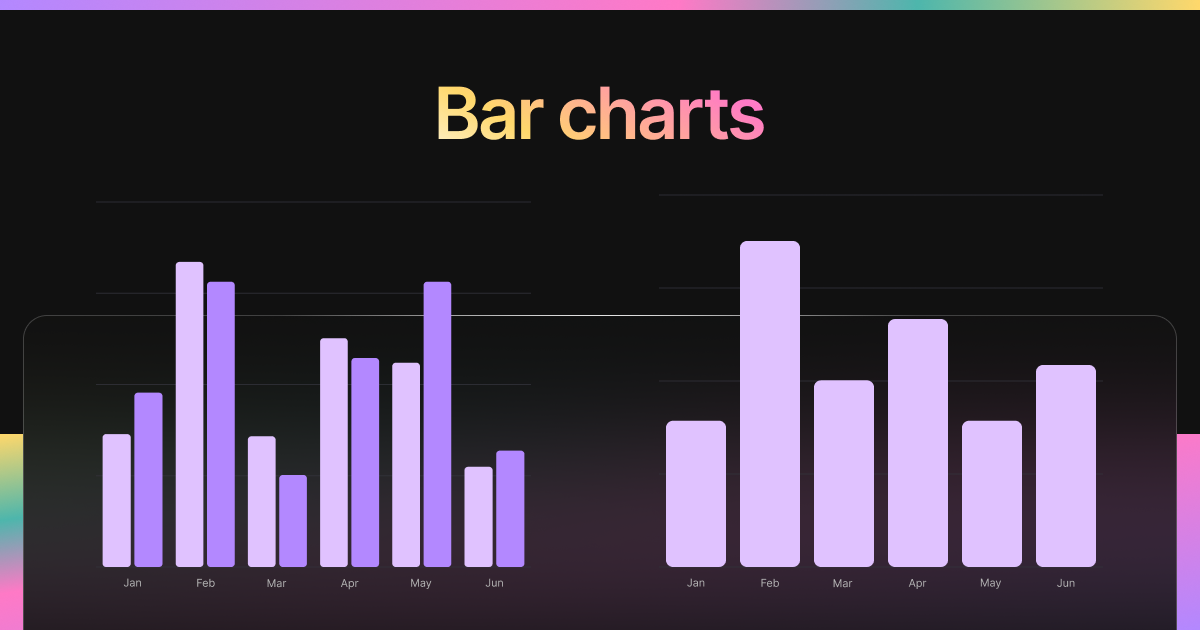
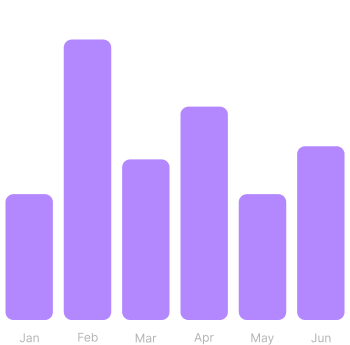
Bar · Chart
Bar Chart
Embed dynamic bar charts in Notion to visualize comparisons, totals, or trends across categories. Configure axes, labels, and display settings easily.
Open type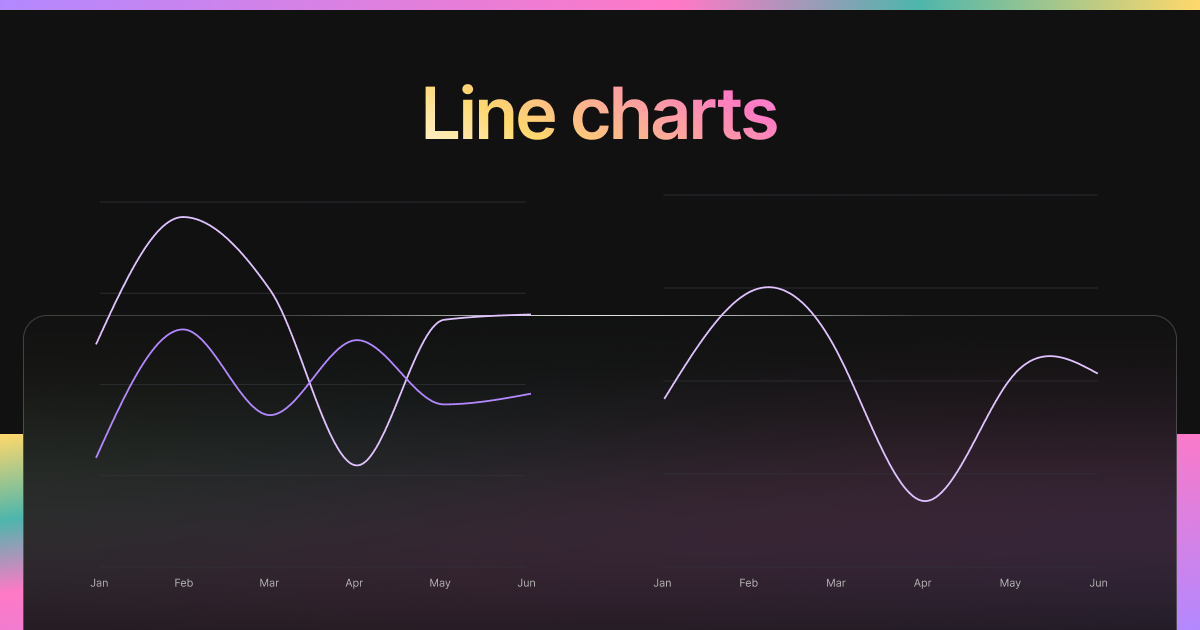
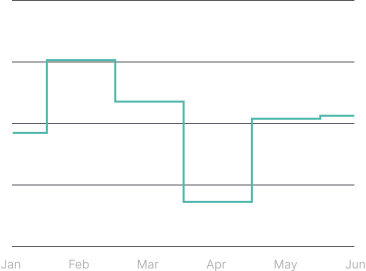
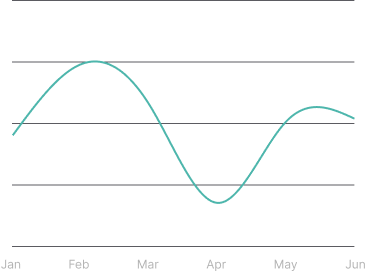
Line · Chart
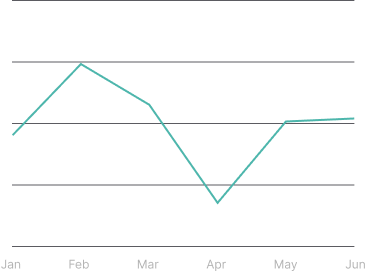
Line Chart
Track changes and patterns with line charts embedded in Notion. Customize styles, labels, stroke width, dots, margins, and more for analytical precision.
Open type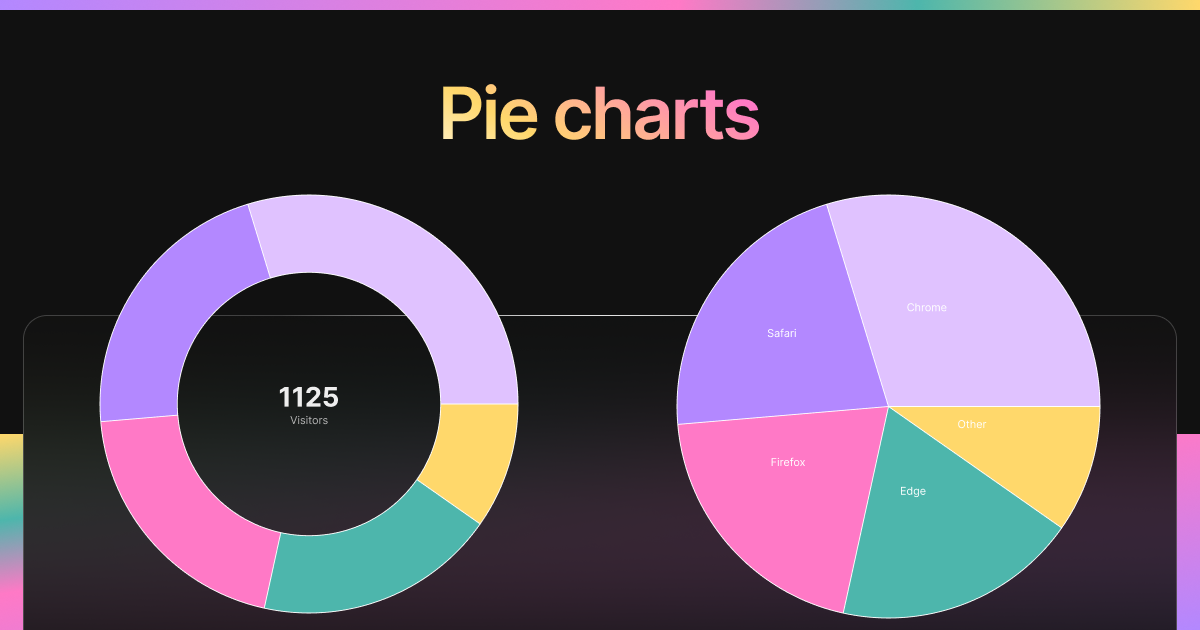
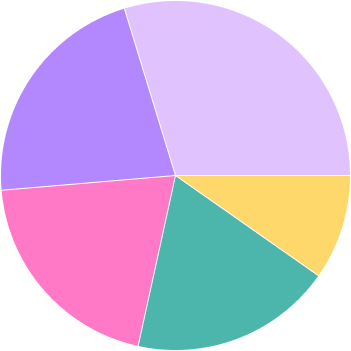
Pie · Chart
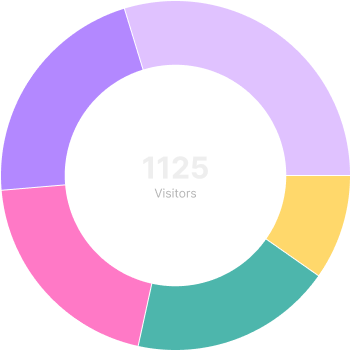
Pie Chart
Use pie charts to break down categories and proportions within your Notion dashboards. Toggle labels, legends, and optional donut mode.
Open type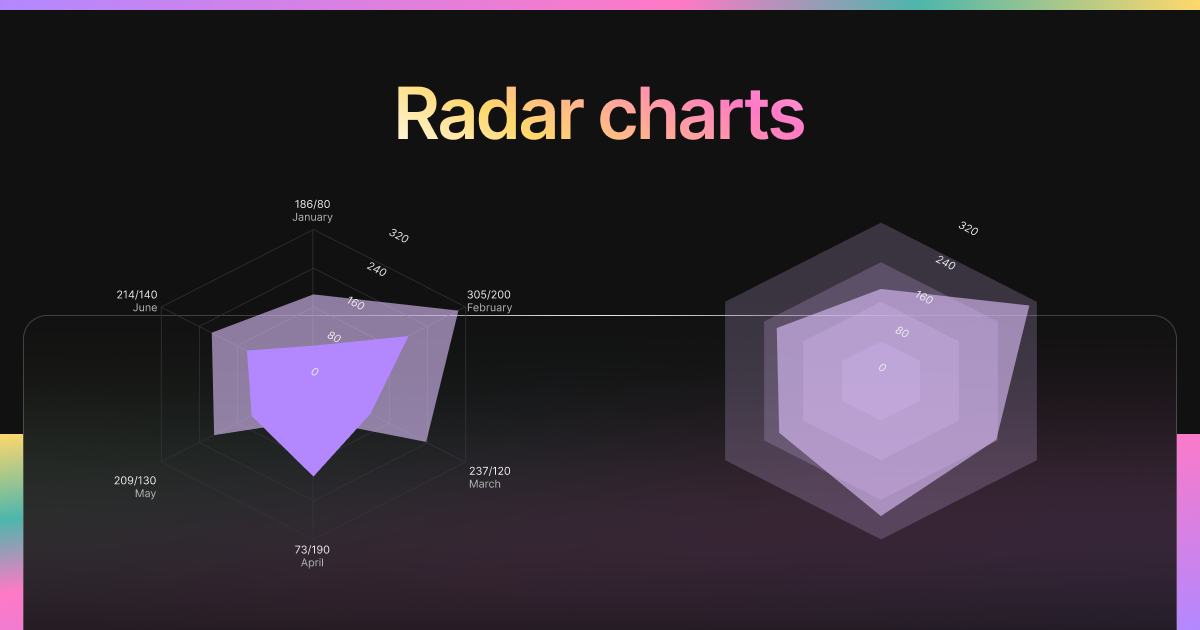
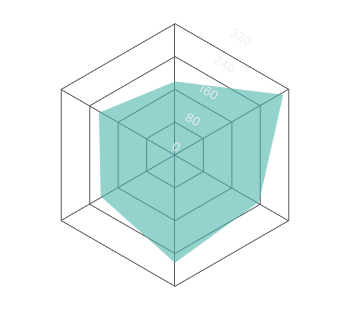
Radar · Chart
Radar Chart
Embed radar charts in Notion to analyze performance across multiple dimensions. Ideal for comparing metrics, personality traits, or skills.
Open type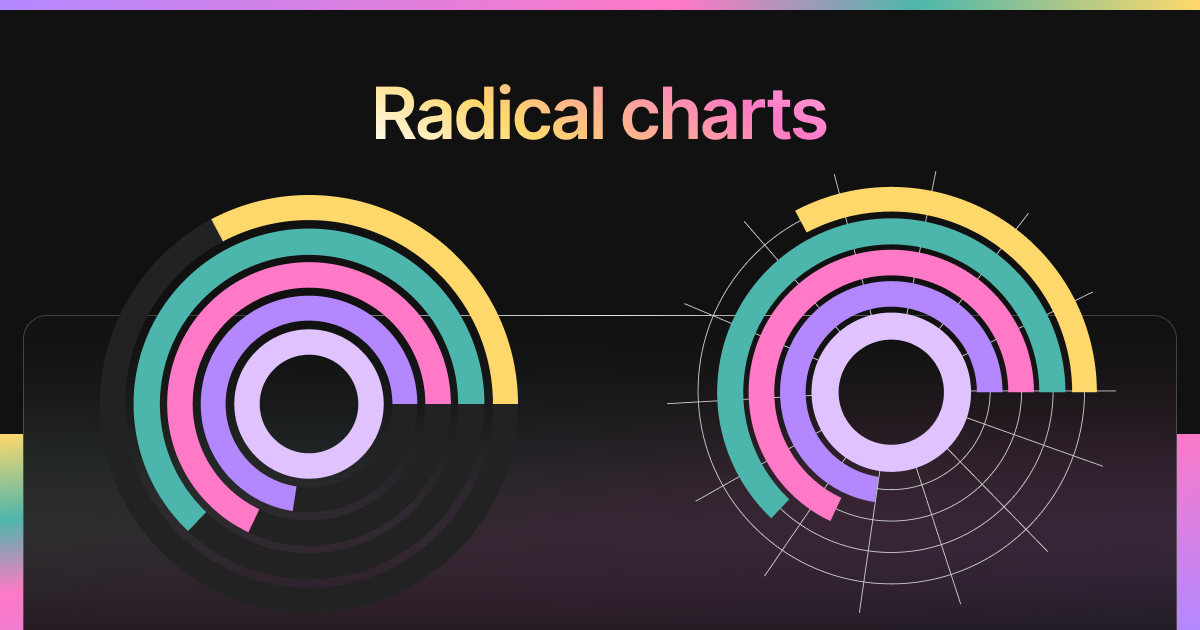
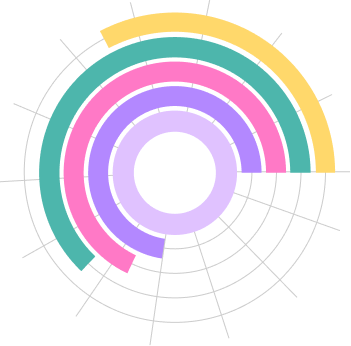
Radical · Chart
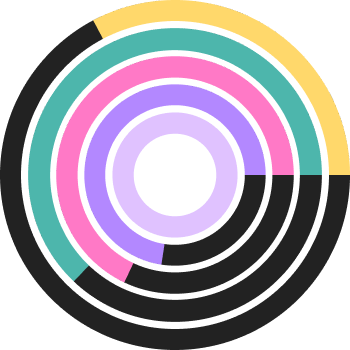
Radial Chart
Radial charts are circular progress-style widgets for showing completion, contribution, or status at a glance in Notion dashboards.
Open typeField notes — Charts
Field notes — Charts
Choose a Notion chart widget
Chart widgets help turn numbers, goals, and recurring metrics into a readable Notion dashboard. Use this hub to compare visual formats before choosing the chart style that best matches the data you track.
- Use bar charts for category comparisons, budgets, and scorecards.
- Use line or area charts for trends over time, such as habits, revenue, or study hours.
- Use pie, radar, or radial charts when you want a compact overview of proportions, strengths, or progress.
Build a charts widget or return to the full index.